If you never worked with Testable before, you can check out our 10-minute introduction video here
The Go/No-go task is a simple experimental paradigm that requires participants to respond by pressing a button when they see a “go” signal, and not respond when they see the “no-go” signal. The key behaviour measured with this experiment is the participants’ ability to withhold a response on No-go trials. This is especially difficult if Go-trials outnumber No-Go trials. Psychologists call the ability to ignore automatic and habitual responses in favour of more deliberate actions ‘inhibition’.
The inhibition required to perform well in the Go/No-go task seems to generalise well to more complex behaviours. In a recent study by Xia et al. (2020) for example, the researchers hypothesised that high trait anxiety can be linked to poor response inhibition. Affected individuals struggle to inhibit dysfunctional thoughts and behaviours that manifest as anxiety. In their research, they used the Go/No-Go task in conjunction with EEG measurements.
As they predicted, individuals with high trait anxiety performed more poorly on No-go trials in the task than individuals with low trait anxiety. By running this task together with EEG measurements, they linked the impaired performance to a deficit in early response selection in pre-motor areas of the brain that are responsible for action planning.
Thanks to its ease and versatility, this task is still widely used to test response inhibition between different participant groups.

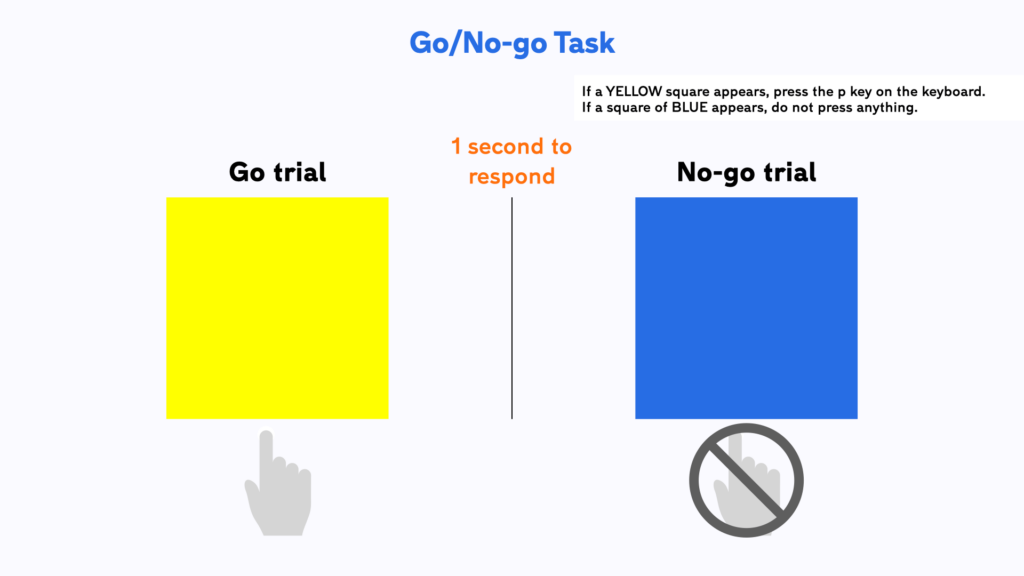
The Go/No-go task is straightforward for participants. Before the task begins, they learn that they will need to press a button when they see a yellow square and not press it when the square is blue. Of course, any other stimuli combinations and response types can be used to create “Go” and “No-go” pairings.
In each trial either the Go or the No-go image is shown for a brief period of time (1 second) and participants need to either respond or not respond.
A larger number of trials will be Go trials. This can make the task feel quite boring to participants. But this is deliberate, as the Go response needs to become habituated and feel automatic. This will make the occasional No-go trial challenging and require the brain to inhibit the now habitual Go response.
Run the Go/No-go task in Testable starting from our ready-made template
We have created a template for the Go/No-go task in Testable for you that you can access from our Library. It is set up and ready to go and you can start collecting data straight away by sending the experiment link to your participantsafter importing it to your projects. Experiments in Testable will run in every browser, which makes it very easy to collect data both in the lab as well as online.
The key effect in this task lies in the difference in performance between Go and No-go trials. We count a Go trial as successful when participants give a response within the specified time window (1 second in our template). On the other hand, we score a No-go trial as successful when participants do not respond at all.
Inhibiting a habitual response is effortful and takes the brain time to process. Poor response inhibition can be a sign disorders such as anxiety and OCD.
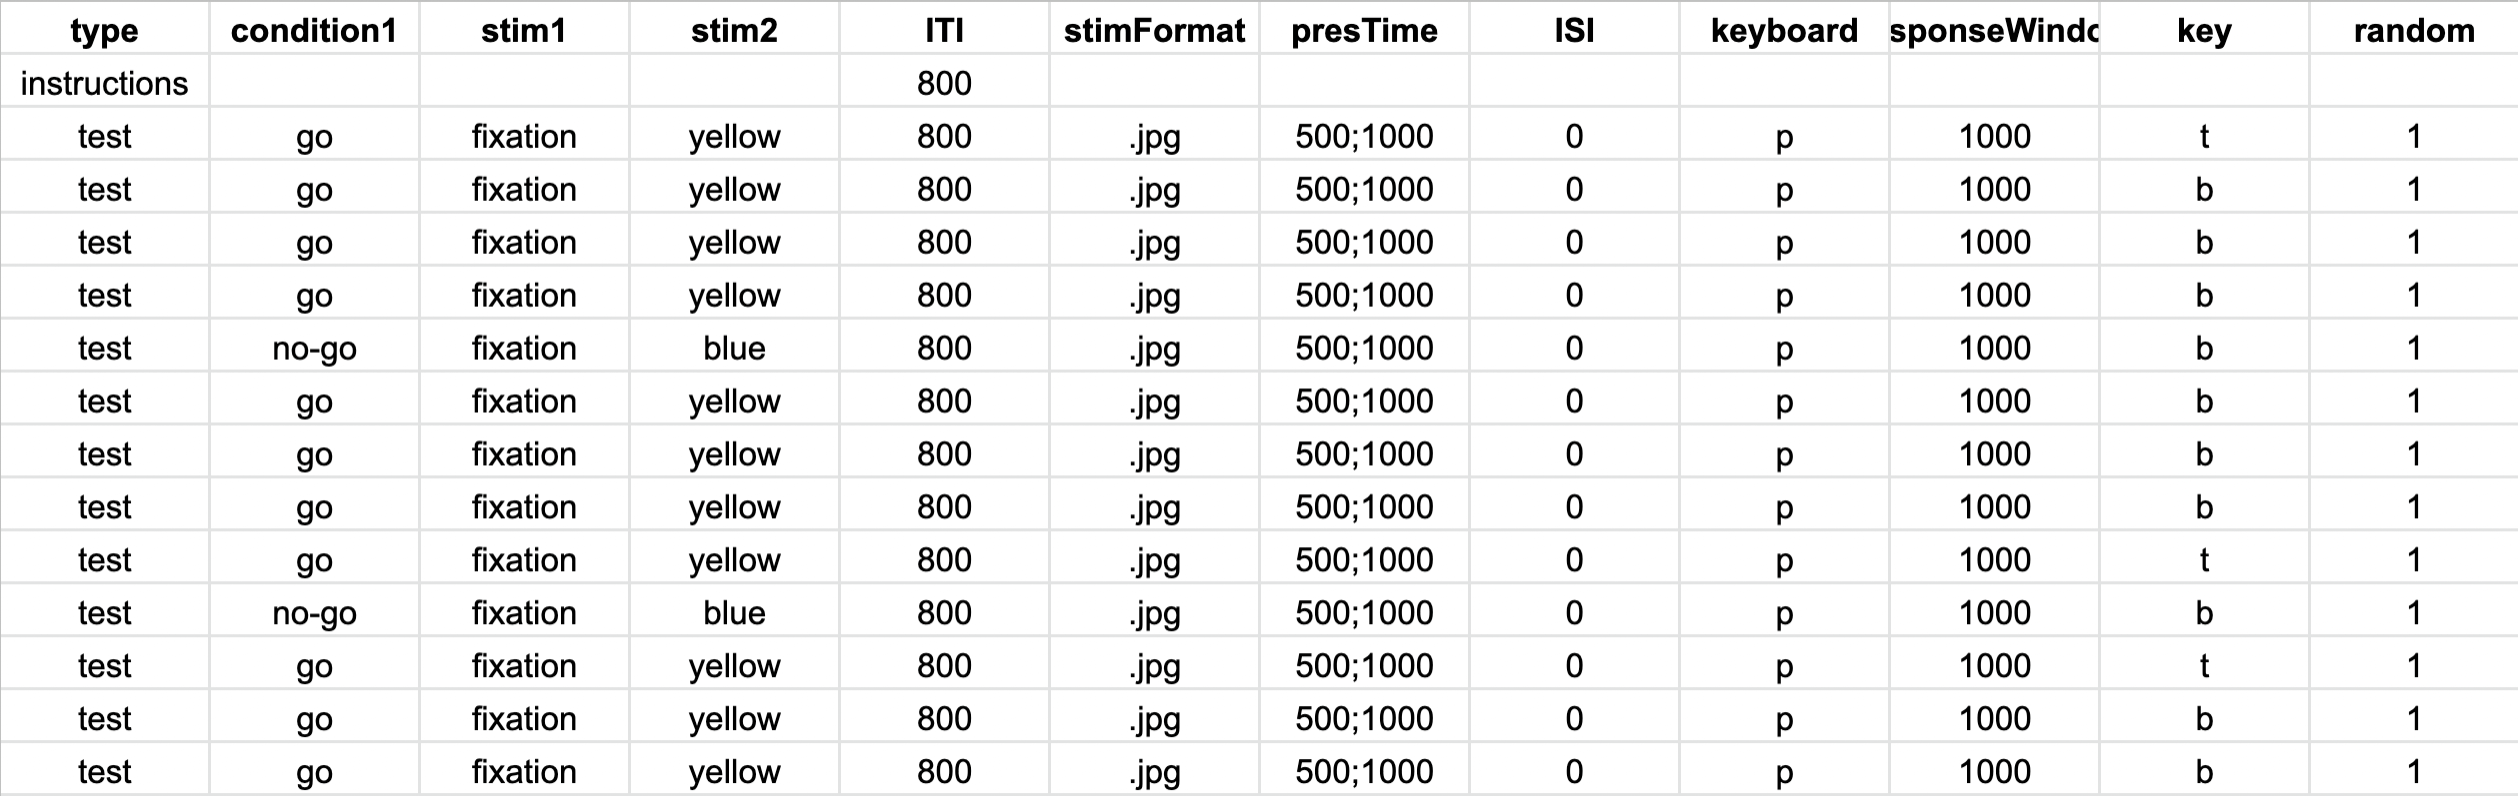
Experiments in Testable are fully customisable and you will not need to write a single line of code to edit them. The heart of each experiment is what we call the trial file. The trial file contains all information that Testable needs to run the experiment in a simple spreadsheet, that you can edit with any spreadsheet editor you like, such as Google Sheets, Excel, or Testable’s in-built preview editor.
To change any part of your experiment, you only need to change the values in the trial file.
Here are a few examples of changes you might want to make to the Go/No-go task:
Stimuli
The default experiment uses a yellow and blue square as Go and No-go stimuli. You can replace these images with any images you want to use. You will first need to upload your custom images to the stimuli library of the project in Testable. Then you can change the stimulus names in the stim columns of the trial file (stim1 & stim2) to match the names of the files you have uploaded (without their extension). Make sure that you have specified the correct image format (e.g. .png, .jpg, .bmp etc.) in the ‘stimFormat‘ column.
Change the the Go/No-go signals
By default, the yellow square is the Go and the blue square the No-go signal. To change this, you will need to change the instructions at the beginning of the experiment which you can find in the title and content columns of the instructions row. We have also added a custom column called condition1.
Here, we are coding the condition (Go or No-go) depending on the instructions that we are giving at the beginning of the experiment. This column doesn’t change the experiment in any way, but it will make data analysis easier as it will appear in the results file as well. There are 4 Go trials for every No-go trial in this experiment that are shown in a randomised order.
Change the response types
In this version of the task participants can respond by pressing the letter ‘p’ on the keyboard. This is defined in the column keyboard. You can change the response key by typing any other character (or ‘enter’, ‘space’ and the arrow keys: ‘left’, ‘right’, ‘up’ and ‘down’).
You could also change the response type completely by allowing them to use their mouse to click on the screen by replacing the keyboard column with a column called responseType and changing the rows to ‘clicks’. Alternatively, you could even allow participants to respond with their voice by using filling ‘mic’ into the responseType column.
Collect data by sending the experiment link to your participants
Once you have made your changes, you can save and upload the modified trial file to your experiment’s trial file section.
After importing this template to your library, you can collect data for your experiment by sharing the unique experiment link (i.e. tstbl.co/xxx-xxx) with your participants. Once participants complete the experiment, their results will appear in the ‘Results’ section of your experiment.
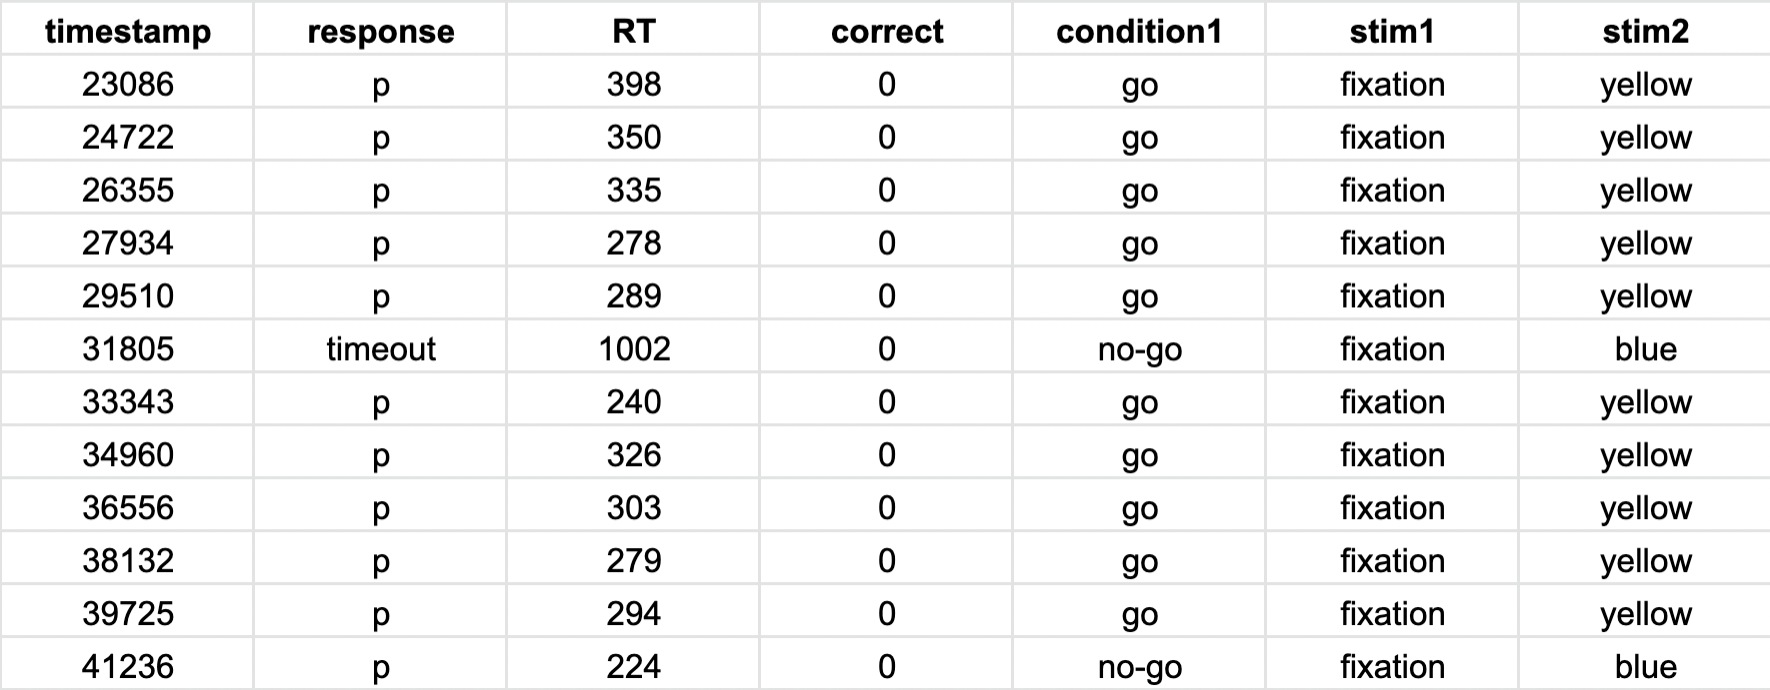
The results file that you get when a participant completes the Go/No-go task contains all the information from your trial file and additional columns about the participants’ responses. The column from the results that will be most useful for your analysis is the response column. Here you can find the key that was pressed in a trial or if no response was given (timeout).
The dependent measure that is most interesting in the Go/No-go task is the proportion of commission errors. Commission errors are responses on No-go trials. The higher the commission error rate, the less the participant was able to inhibit the habituated from Go-trials.
You can easily compute the commission error rate by dividing the number of responses that have not timed out by the number of total No-go trials presented. Usually, you will compare the commission error rate between different groups of participants that differ from each other in some way, like in the earlier example about comparing the Go/No-go performance of individuals with high and low trait anxiety.
Once you have collected data from multiple participants, you can also use Testable’s ‘wide format’ feature, which allows you to automatically collate all individual result files into a single file. In wide format, every participant’s data is represented as one row in the data. This makes it easily compatible with statistical analysis packages like R or SPSS where you can assess the statistical significance of any differences you may find.
Reference list:
Donders, F. C. (1868). Over de snelheid van psychische processen [On the speed of mental processes], Tweede reeks, 11, 92±130. Translated by WG Koster (1969). Attention and performance, 2.
Xia, L., Mo, L., Wang, J., Zhang, W., & Zhang, D. (2020). Trait anxiety attenuates response inhibition: evidence from an ERP study using the Go/NoGo task. Frontiers in behavioral neuroscience, 14, 28.