Reviewed by: Constantin Rezlescu | Associate Professor | UCL Psychology
If you never worked with Testable before, you can check out our 10-minute introduction video here
We do not see our world as a large collection of individual lines, colours and shapes. Instead we perceive a coherent visual scene with complex objects that we understand. But how do our brains accomplish this? Do we first perceive all the basic features and then bind them as a whole? Or do we rather perceive the whole before we can actively search for more detail if needed? In 1980, Treisman and Gelade developed the visual search task (VST) as a simple way to test both theories.
In this task, participants need to find a target in a scene of distractors. Usually, the target has a particular shape and colour (e.g red triangle 🔺 ) and needs to be spotted among distractors. Distractors could have a different color (blue triangles) a different shape (red squares) or both (blue squares).
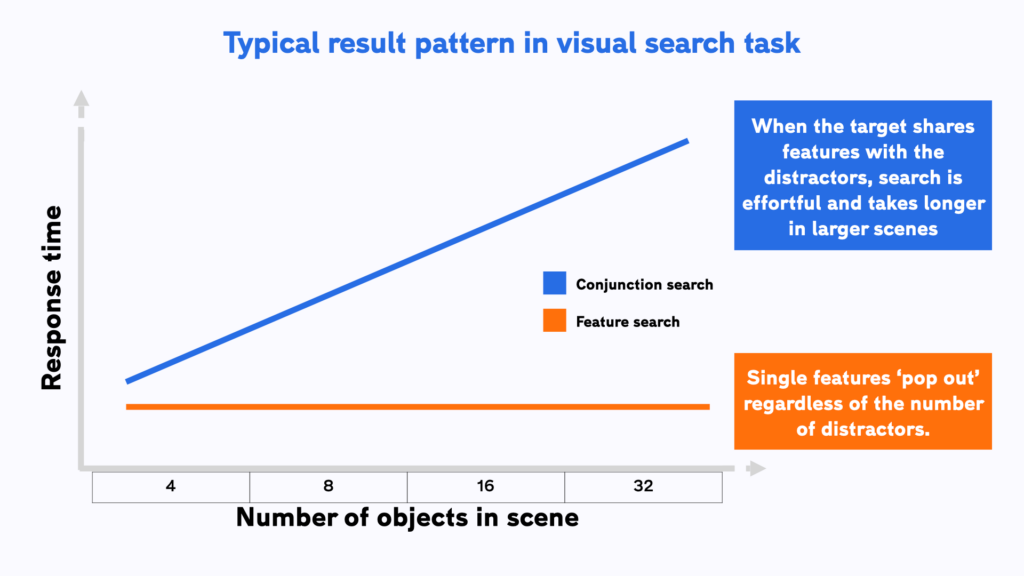
The hallmark observation from the VST is the ‘pop-out’ effect. Targets ‘pop-out’ from a cluttered visual scene as long as they can be identified unambiguously by a single feature. You can instantly spot a target, regardless of the number of distractors, if it is the only red object. This is the reason why signal colours are so effective. Think of bright yellow safety vest, which can capture our attention even in the most crowded visual scene.
The process by which we can recognise a single stand-out feature in our visual scene is called feature search. The insight about the superiority of feature search has been invaluable to marketeers. They can use experiments similar to the VST to develop product packaging and branding that ‘pops out’ from its competitors.
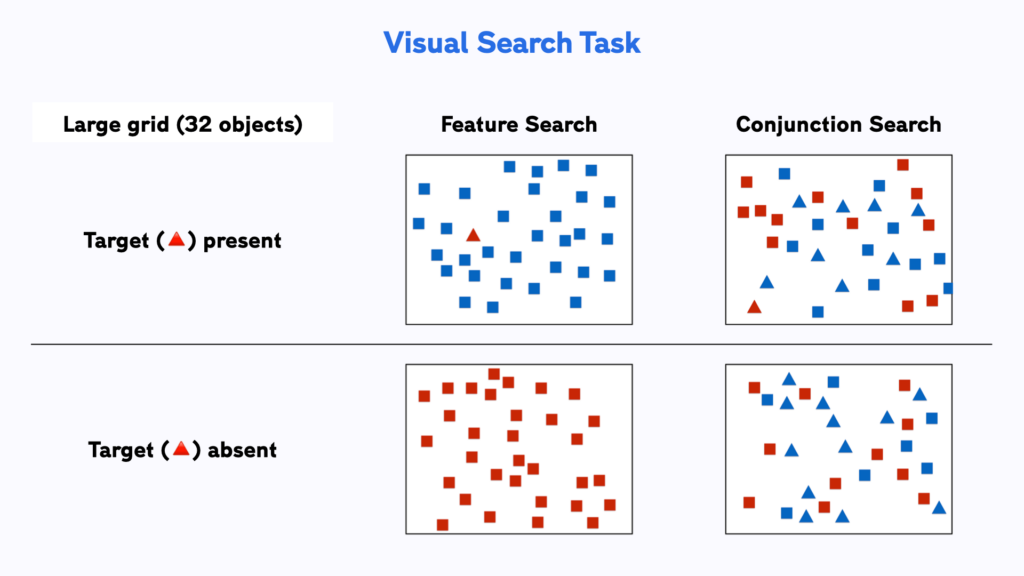
When the target shares features with the distractors, the number of distractors matters. If the target is red triangle, shared-feature distractors might be blue triangles or red squares. In this case it is almost as if we need to scan each object individually for the right feature combination. This effortful mental process is called conjunction search.
This combination of findings suggests that we have automatic and rapid access to “lower level” visual features. This allows us to process some aspects of our entire visual scene at once. More complex, “higher level” objects require the binding together of multiple features. This solicits our selective attention and can only be processed one at a time. Although we are aware of our visual world as a meaningful ‘whole’ it seems that our brains need to puzzle it together from its constituent parts.

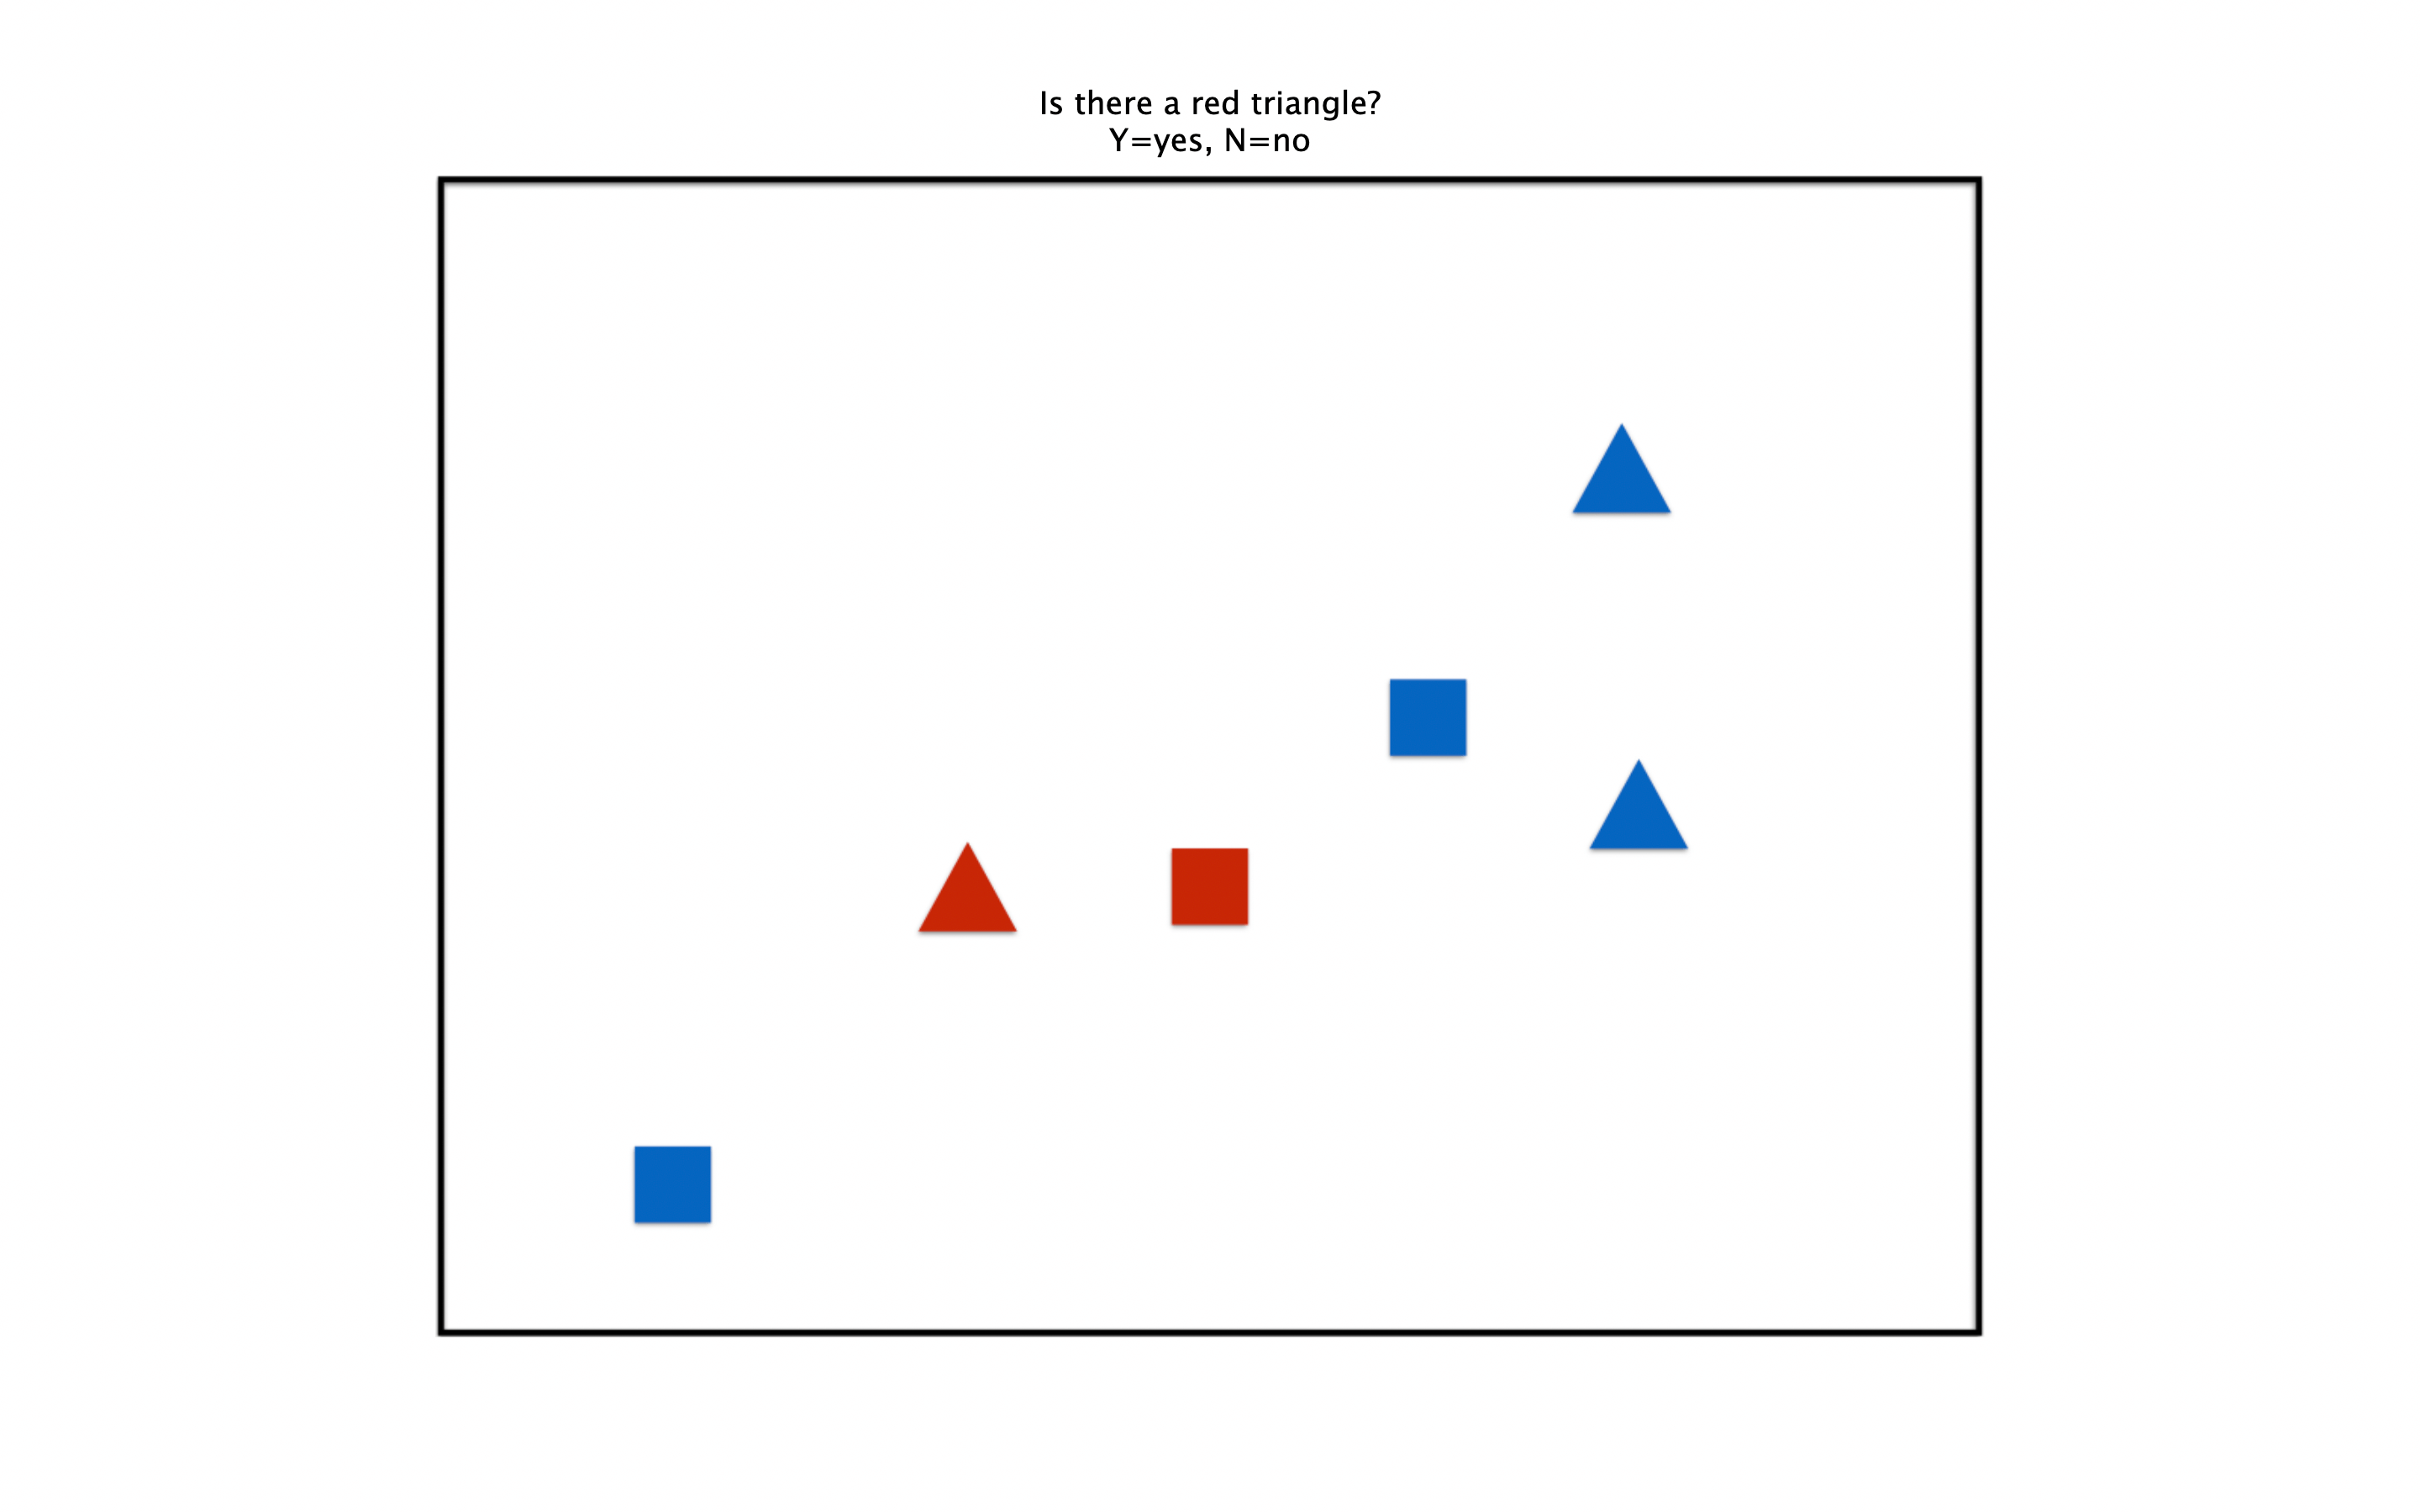
At the beginning of the task participants are shown a target object that they need to look out for. The target is surrounded by other, similar shapes that act as distractors. It is much like a simplified game of “Where’s Wally”. In our example the target is a red triangle (🔺) surrounded by scattered distractors. These could have a different color (blue triangles), a different shape (red squares) or both (blue squares).
It is the participant’s task to use the keyboard to indicate if the target is present (‘y’) or absent (‘n’) in the scene. Typically, three aspects of the scene are varied from trial to trial:
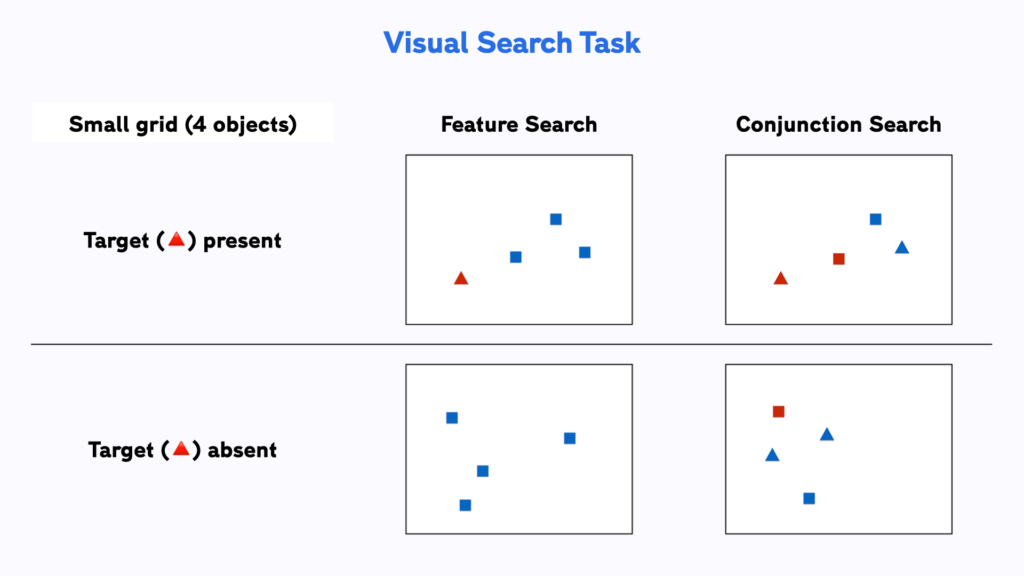
This results in 16 unique trial conditions, which each have 5 visual scene examples associated with them. This amounts to a total of 80 trials in our demo experiment and should be sufficient to observe a meaningful effect.
In feature search trials it is enough to spot one of the target’s characteristics (either red colour, or triangle shape) to distinguish it from the distractors. Conversely, in conjunction trials, one must look for the combination of red color and triangle shape, as there are other red and triangular distractors around.
Fore each trial we measure if the participant correctly indicated whether the target was among the distractors (accuracy), and how quickly they did so (response time).
Run this experiment in Testable from our ready-made template
We have created a template for the VST in Testable for you that you can access from our Library. It is set up and ready to go and you can start collecting data straight away by sending the experiment link to your participant. Experiments in Testable will run in every browser, which makes it very easy to collect data both in the lab as well as online.
Experiments in Testable are fully customisable and you will not need to write a single line of code to edit them. The heart of each experiment is what we call the trial file. The trial file contains all information that Testable needs to run the experiment in a simple spreadsheet, that you can edit with any spreadsheet editor you like, such as Google Sheets, Excel or Testable’s in-built preview editor.
To change any part of your experiment, you only need to change the values in the trial file.
Once you have made your changes, you can save and upload the modified trial file to your experiment’s trial file section.
After importing this template to your library, you can collect data for your experiment by sharing the unique experiment link (i.e. tstbl.co/xxx-xxx) with your participants. Once participants complete the experiment, their results will appear in the ‘Results’ section of your experiment.
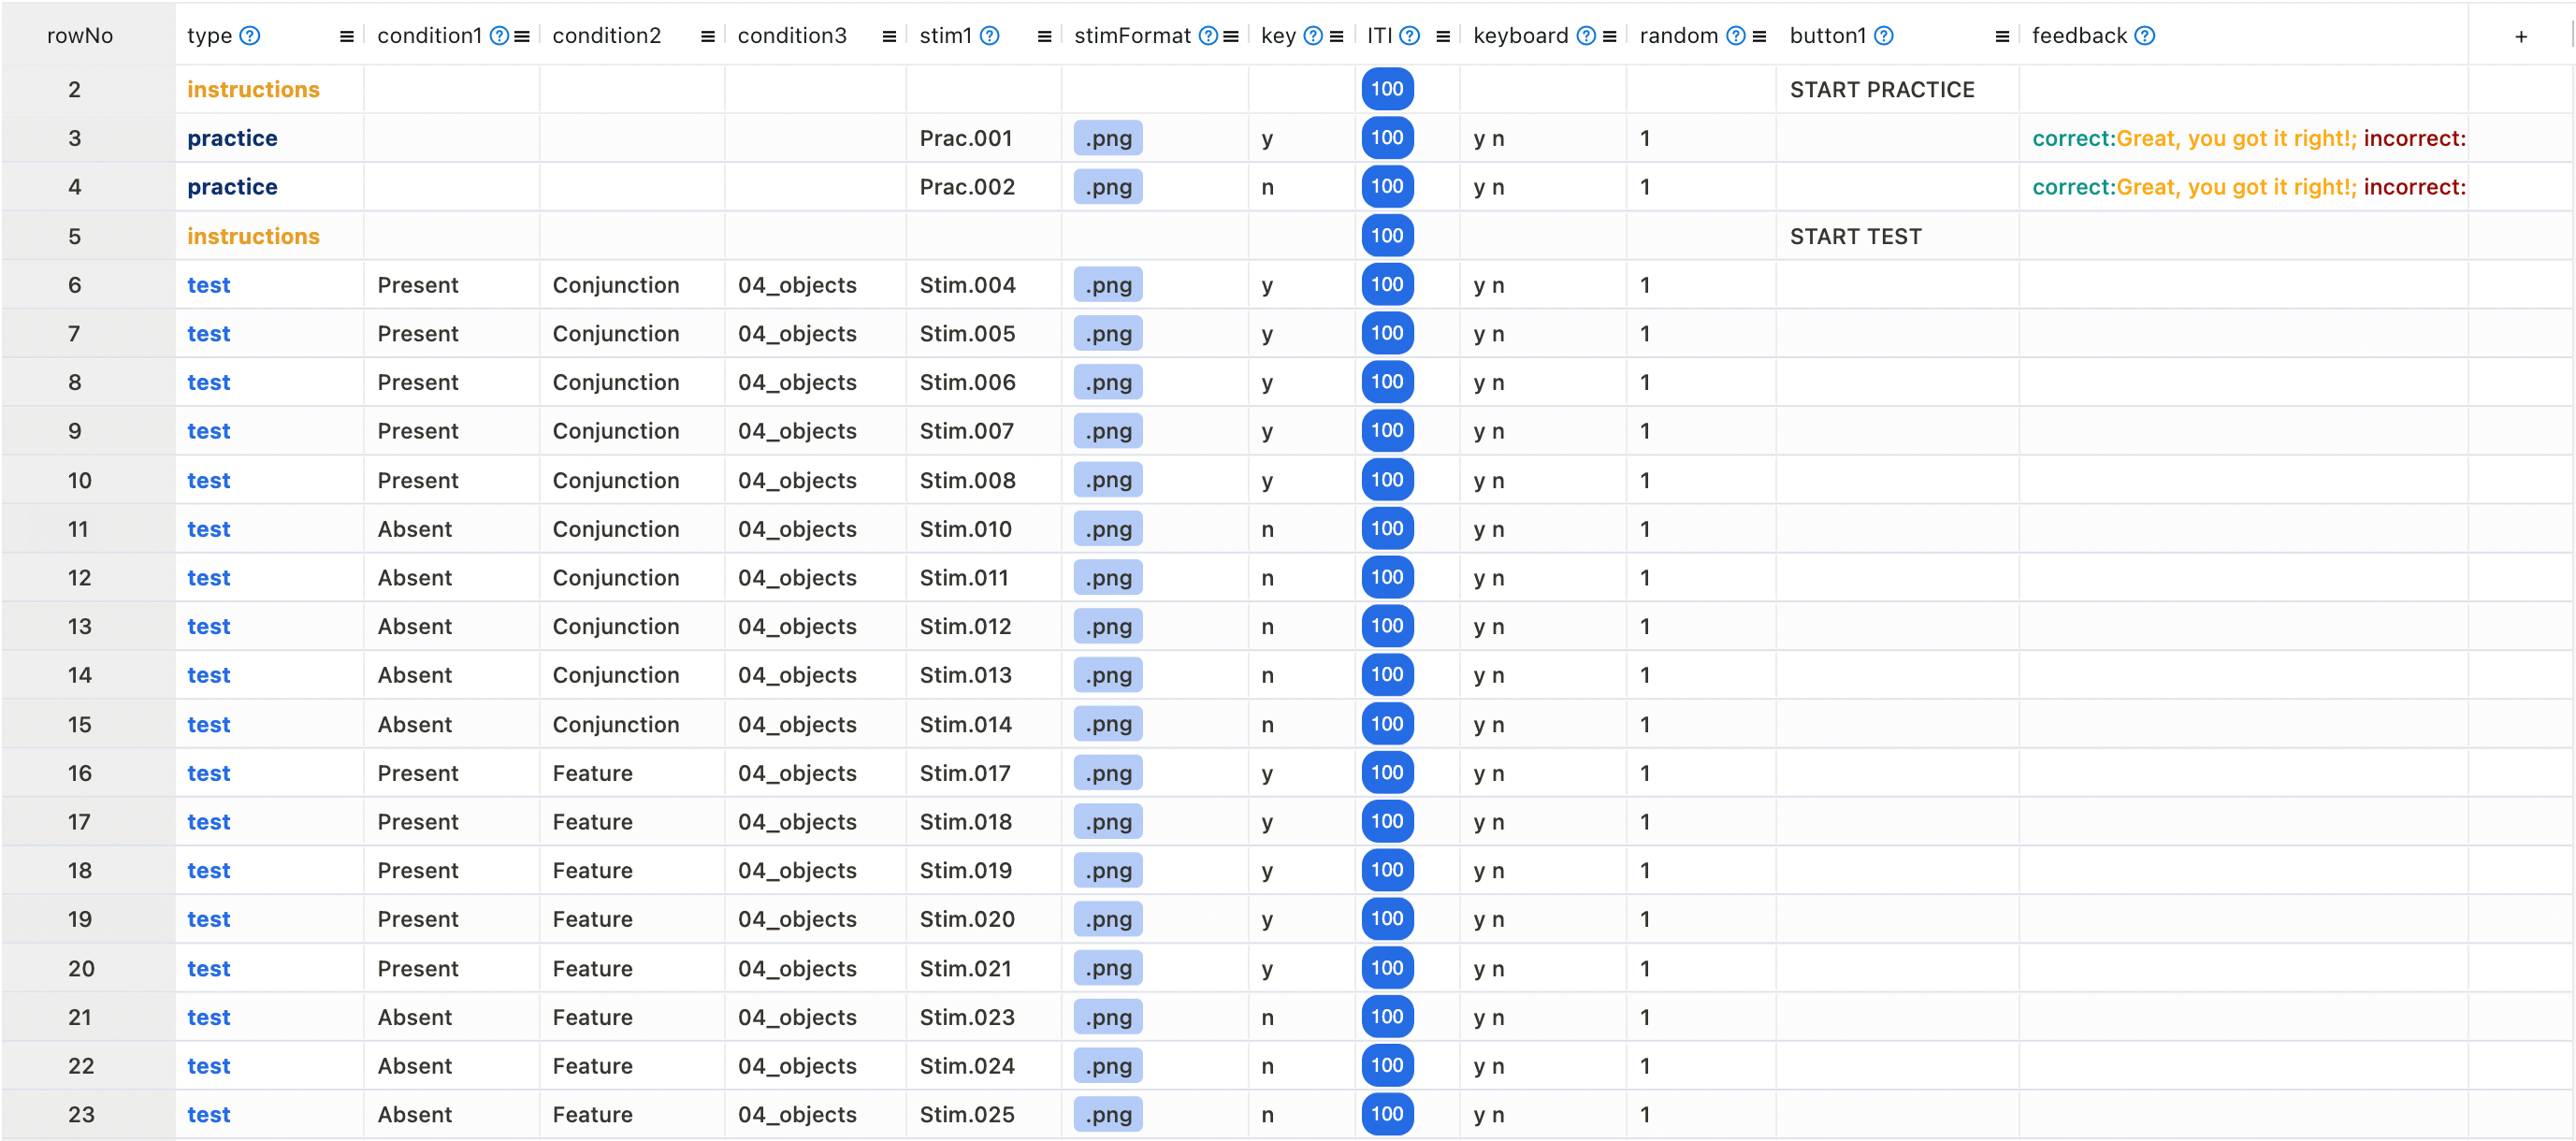
This version of the VST automatically measures a participants’ response time (RT column) and accuracy (correct column) for indicating whether the target was present or not in a trial.
In the trial file we have defined three columns called condition1, condition2 and condition3 that each code one dimension that the stimuli were varied on in this task. condition1 tells us if it was present or not, condition2 tells us if feature search (target can be identified by a single feature) or conjunction search (target can only be identified using a combination of features) and condition3 codes the number of objects in a scene (4-32). We added these columns manually added to the trial file and they have no bearing on the logic of the experiment. But they do come handy for our analysis, as we can now easily group the response times and accuracies for each level of experimental conditions and calculate their mean values.
There are two key effects that you should observe when running the VST:
In technical language you would be looking for a main effect of search type, which means that overall conjunction search takes longer than feature search. In addition, you are looking for an interaction between search type and array size. That means that the response times you can expect for the different array sizes depends on the search type required for that trial. This interaction effect allows us to conclude that single features can ‘pop out’ in crowded a visual scene. But once we need to combine features to identify an object, we need to process objects one by one using conscious attention. This takes longer and is more effortful.
Once you have collected data from multiple participants, you can also use Testable’s ‘wide format’ feature, that allows you to automatically collate all individual result files into a single file. In wide format results every participant’s data shows up as one row in the data file. This makes it easily compatible with statistical analysis packages like R or SPSS where you can assess the statistical significance of any differences you may find.
Reference list:
Treisman, A. M., & Gelade, G. (1980). A feature-integration theory of attention. Cognitive Psychology, 12(1), 97–136. doi:10.1016/0010-0285(80)90005-5
Jansson, C., Marlow, N., & Bristow, M. (2004). The influence of colour on visual search times in cluttered environments. Journal of Marketing Communications, 10(3), 183-193.