Reviewed by: Constantin Rezlescu | Associate Professor | UCL Psychology
If you never worked with Testable before, you can check out our 10-minute introduction video here and come back
The original paper by David Navon (1977) is probably one of the first articles psychology undergraduates encounter as they dive into visual perception. The guiding intuition is that when we see a forest, we don’t just see a collection of trees. Instead the forest becomes its own object or ‘gestalt‘ that is more than just the sum of its trees. The Navon task shows that most of us are biased to see the big picture before its parts. In other words, most of us have a preference for the ‘bigger picture’ compared to the individual details.
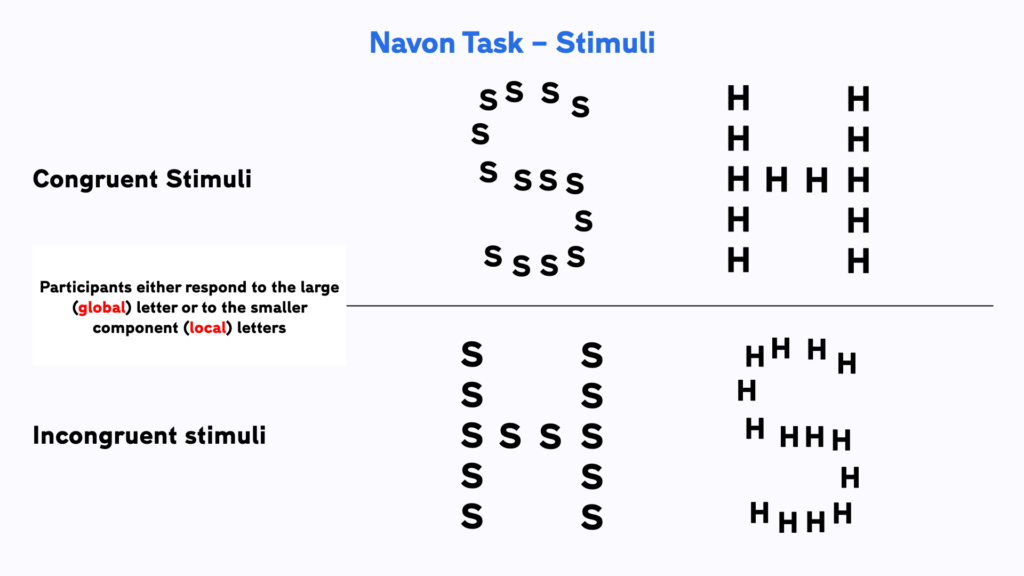
The original version of the Navon task features images of letters that are themselves made up of smaller letters. These smaller letters can either be the same (congruent) or different (incongruent) from the large letter. Participants need to pay attention to either the large letter or the smaller component letters.
By measuring reaction times and accuracy we can estimate how the larger shape interferes with recognising the smaller letters and vice versa. Usually, participants are much better to ignore misleading smaller letters than a misleading whole.
This ‘gestalt-principle’ (the whole is more than the sum of its parts) applies to other areas of perception as well. For example, it is difficult to perceive faces when they are upside down. Although an upside-down face has all the same low-level features as an upright face, the resulting ‘global’ gestalt is different. Our brains perceive it as a different whole. The Navon task can help us understand the degree to which general problems with face recognition might be caused by general issues with global object processing (e.g. Duchaine, Yovel & Nakayama 2007).

The Navon task is a simple forced-choice paradigm where participants need to choose between two responses after seeing a stimulus. In our example we use the letters ‘H’ and ‘S’ made up of smaller ‘H’s and ‘S’s as stimuli. Participants need to either:
a) identify the larger letter, and press the appropriate key (‘s’ or ‘h’) on the keyboard (global condition)
b) pay attention to the smaller letters and identify those by pressing one of the same keys (local condition).
Usually, the Navon Task uses a within-subjects design. That means that all participants are seeing both conditions (global and local). In this demo, there are 20 randomised trials per condition. The stimuli look the same in both conditions. Only the instructions will differ, telling participants to pay attention to either the local or global level.
After a brief fixation period, the stimuli appear on screen until the participants respond and the next trial begins. We measure reaction times as well as the response accuracy for each trial.
The Navon task measures if responses are correct (accuracy) and how long it took participants to respond (response time).
This allows us to observe two separate effects.
Larger reaction time cost differences between the global and the local condition =
Stronger “global bias” (tendency to perceive the big picture over its component parts)
We have created a template for the Navon task in Testable for you that you can access from our Library. It is set-up and ready to go and you can start collecting data straight away. Experiments in Testable will run in every browser, which makes it very easy to collect data both in the lab as well as online.
Collect data by sending the experiment link to your participants
Once you have made your changes, you can save and upload the modified trial file to your experiment’s trial file section.
You can collect data for your experiment by sharing the unique experiment link (i.e. tstbl.co/xxx-xxx) with your participants. Once participants complete the experiment, their results will appear in the ‘Results’ section of your experiment.
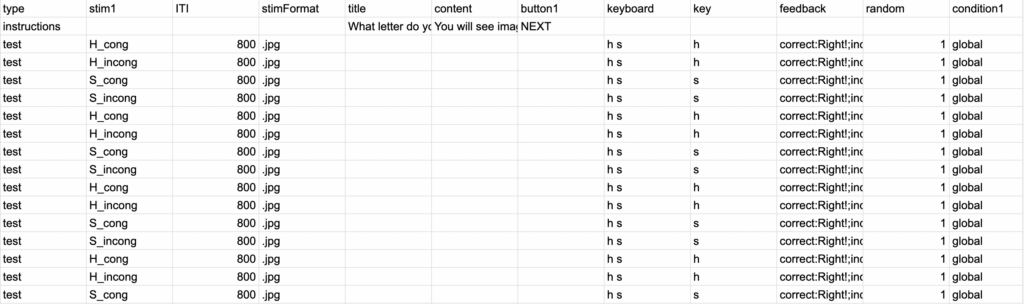
Experiments in Testable are fully customisable and you will not need to write a single line of code to edit them. The heart of each experiment is what we call the trial file. The trial file contains all information that Testable needs to run the experiment in a simple spreadsheet, that you can edit with any spreadsheet editor you like, such as Google Sheets or Excel.
To change any part of your experiment, you only need to change the values in the trial file.
Here are a few examples of changes you might want to make to the Navon task:
Randomise stim position
You may want to vary the position of where the stimuli appear on screen. This will make it harder for your participants to develop a strategy where they are focussing on a specific, small area on the screen that can allow them to ignore the global features of the image. By varying the position, you will avoid confounds related to possible ad-hoc strategies participants may develop to solve the task.
In the trial file you can add a column called stimPos that you can use to control the position of your stimuli by specifying pixel coordinates. You can also use position ranges to define an area of possible positions in which the stimuli can appear. For more exact instructions of how to define random positions you can visit our guide here.
Add trials and blocks
Our demo experiment only features two blocks, one for each condition with 20 trials each. For a more reliable measurement, you may want to add more trials for each block and switch between global and local instructions more frequently. For example you could have an experiment that consists of 4 blocks (2 global, 2 local) with 48 trials each, for a total of 192 trials. To add more trials, you can simply duplicate any number of trial-rows in the trial file, making sure that you are maintaining the right proportions for each stimulus type.
You will find the column “random” in the trial file, that marks all trials of the experiment for randomisation. Another column called randomBlock groups all trials that belong to a block which should all stick together. You can find more information on randomisation and block randomisation in Testable here.
The results file that you get from a participation in the Navon task contains all information from your trial file and additional columns about the participants responses. The column from the results that will be most useful for your analysis is the RT (response time) column and also the correct (accuracy) column.
In the trial file we have also defined 2 custom columns called condition1 and condition2. We have used it to mark every trial with the condition they represent. Condition1 codes whether participants need to pay attention to the global or local level of the images and Condition2 indicates if the stimuli were congruent or incongruent. These columns do not affect the experiment in any way, but help us with data analysis as we can now easily group our results with the help of these columns.
For example, if you want to compute the ‘Global processing bias’ of a single participant you could do the following:
Once you have collected data from multiple participants, you can also use Testable’s ‘wide format’ feature. This will automatically collate all individual result files into a single file where every participant’s data is represented as one row in the data. If you prefer, you can also use the ‘long format’. Using this option you’ll get a file that combines the responses from all participants in one long file. This makes it easily compatible with statistical analysis packages like R or SPSS where you can assess the statistical significance of any differences you may find
Reference list:
Navon, D. (1977). Forest before trees: The precedence of global features in visual perception. Cognitive psychology, 9(3), 353-383.
Duchaine, B., Yovel, G., & Nakayama, K. (2007). No global processing deficit in the Navon task in 14 developmental prosopagnosics. Social cognitive and affective neuroscience, 2(2), 104-113.