Published on August 5, 2021
The attentional blink task is a special case of a Rapid Serial Visual Presentation (RSVP) task, that involves the fast presentation of visual stimuli with stimulus-presentation times of 15-75ms
If you never worked with Testable before, you can check out our 10-minute introduction here
Visual attention is the psychological process that helps us make sense of a visual scene. We only have limited resources to process what we see at any given time, and the brain developed strategies that allow it to create a coherent picture of our world. Psychologists can peek into the deeper workings of our visual attention through a phenomenon called the “attentional blink” (AB). The blink is a brief window of time after a first, relevant stimulus has been recognised, in which a second relevant target cannot be perceived.
The AB can be tested using rapid serial presentation of visual stimuli (RSVP), where stimuli are shown sequentially at very short presentation times, usually around 15-75 milliseconds. Even at these short intervals, participants are usually able to identify single targets within a stream of distractors. But if a second target is shown in an interval between 180-270ms after the first, it is often missed completely. The “blind spot” for this second stimulus is the attentional blink.
There is still debate about the exact mechanism that causes the attentional blink. Another question is if the blink serves an adaptive purpose or is simply the side-effect of an underlying limitation.
The most common interpretation is that the attentional blink is evidence of a two-stage model of visual attention. In a first stage, stimuli are superficially scanned. Here, processing is fast and efficient, but stimuli can also be easily forgotten or overwritten.
In the second stage, stimuli can be processed further once they are recognised to be relevant during the first stage. This step allows for identification and memorisation that is more robust, but also more resource-limited. Only one item can be processed at a time in the second stage. The attentional blink occurs when the second target is shown in the period where the first target is still being processed and is using all of the processing resources.
Common manipulations that are used in the AB-task are changes to the stimuli or the timings. It has been shown, for example, that the attentional blink can be reduced if the second target is emotionally salient (e.g Anderson & Phelps (2001)). This demonstrates the influence emotion can have on our attention.
Variations in the types of stimuli (letters, images, words), the timings (Presentation time, Stimulus Onset Asynchrony) and the masking of the targets can also answer specific questions about the circumstances under which the blink can be measured and the implications this has for wider theory (for review see Dux & Marois (2009).

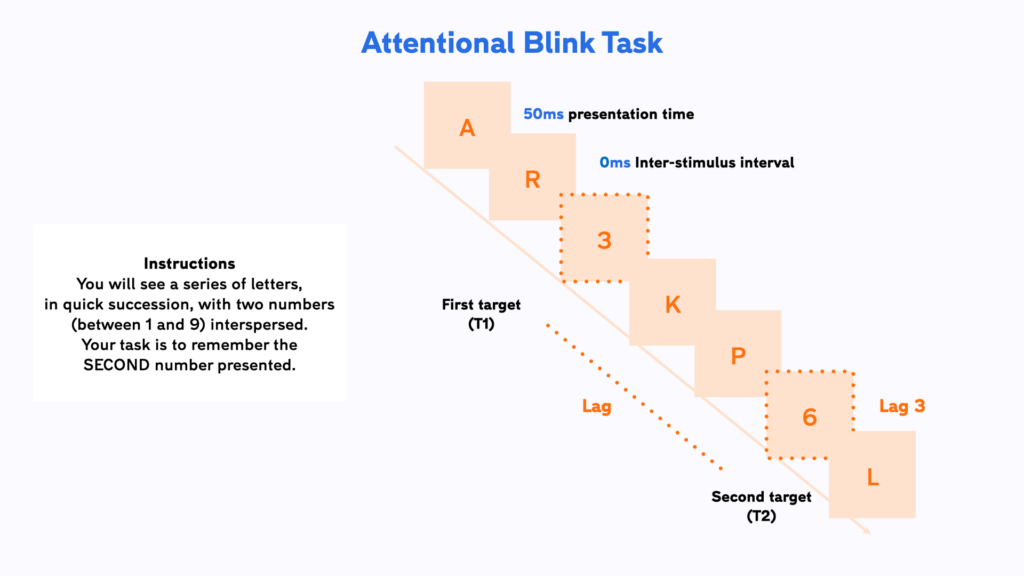
In the Testable version of the attentional blink task, a string of 28 characters is presented in a rapid visual stream. Letter characters are distractors and should be ignored, whilst numbers are targets to which participants need to pay attention to. Each character is presented for 50ms with an inter-stimulus interval of 0 (no break in between stimuli). The participant has to respond by pressing the number on the keyboard that corresponds to the identity of the SECOND number that was shown (T2).
The main variable in the experiment is the so called ‘lag‘ of the second Target (T2) and refers to the number of steps that T2 is presented after T1. In this setup, a T2 stimulus presented at Lag 3 would mean that it is the third stimulus after T1 was shown, equivalent to 100 milliseconds after the offset of T1.
In addition, the position of T1 is varied between position 9 and 20 as well as the identities of T1 and T2, which are never the same number.
Run this experiment in Testable from our ready-made template
You can import this experiment for free from our Library. It is set up and ready to go and you can start collecting data straight away by sending the experiment link to your participantsafter importing it to your projects. Experiments in Testable will run in every browser, which makes it very easy to collect data both in the lab as well as online.
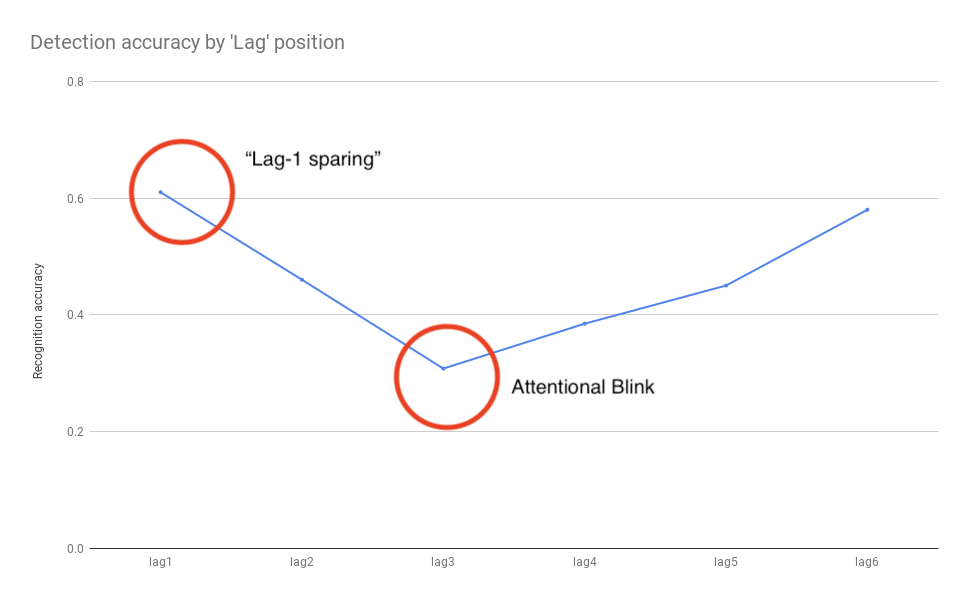
The attentional blink is defined as a decreased likelihood for correctly identifying the second target in a visual presentation stream for certain lag positions, depending on presentation time. This specific drop in recognition accuracy for items that occur in lag positions in the 180-270 millisecond range after the first target is a measure of a momentary attentional unavailability.
Our brains need a little time to fully process a stimulus in working memory to identify and remember it. As a result, the brain can’t process any further stimuli during this time. This brief period is the attentional blink.
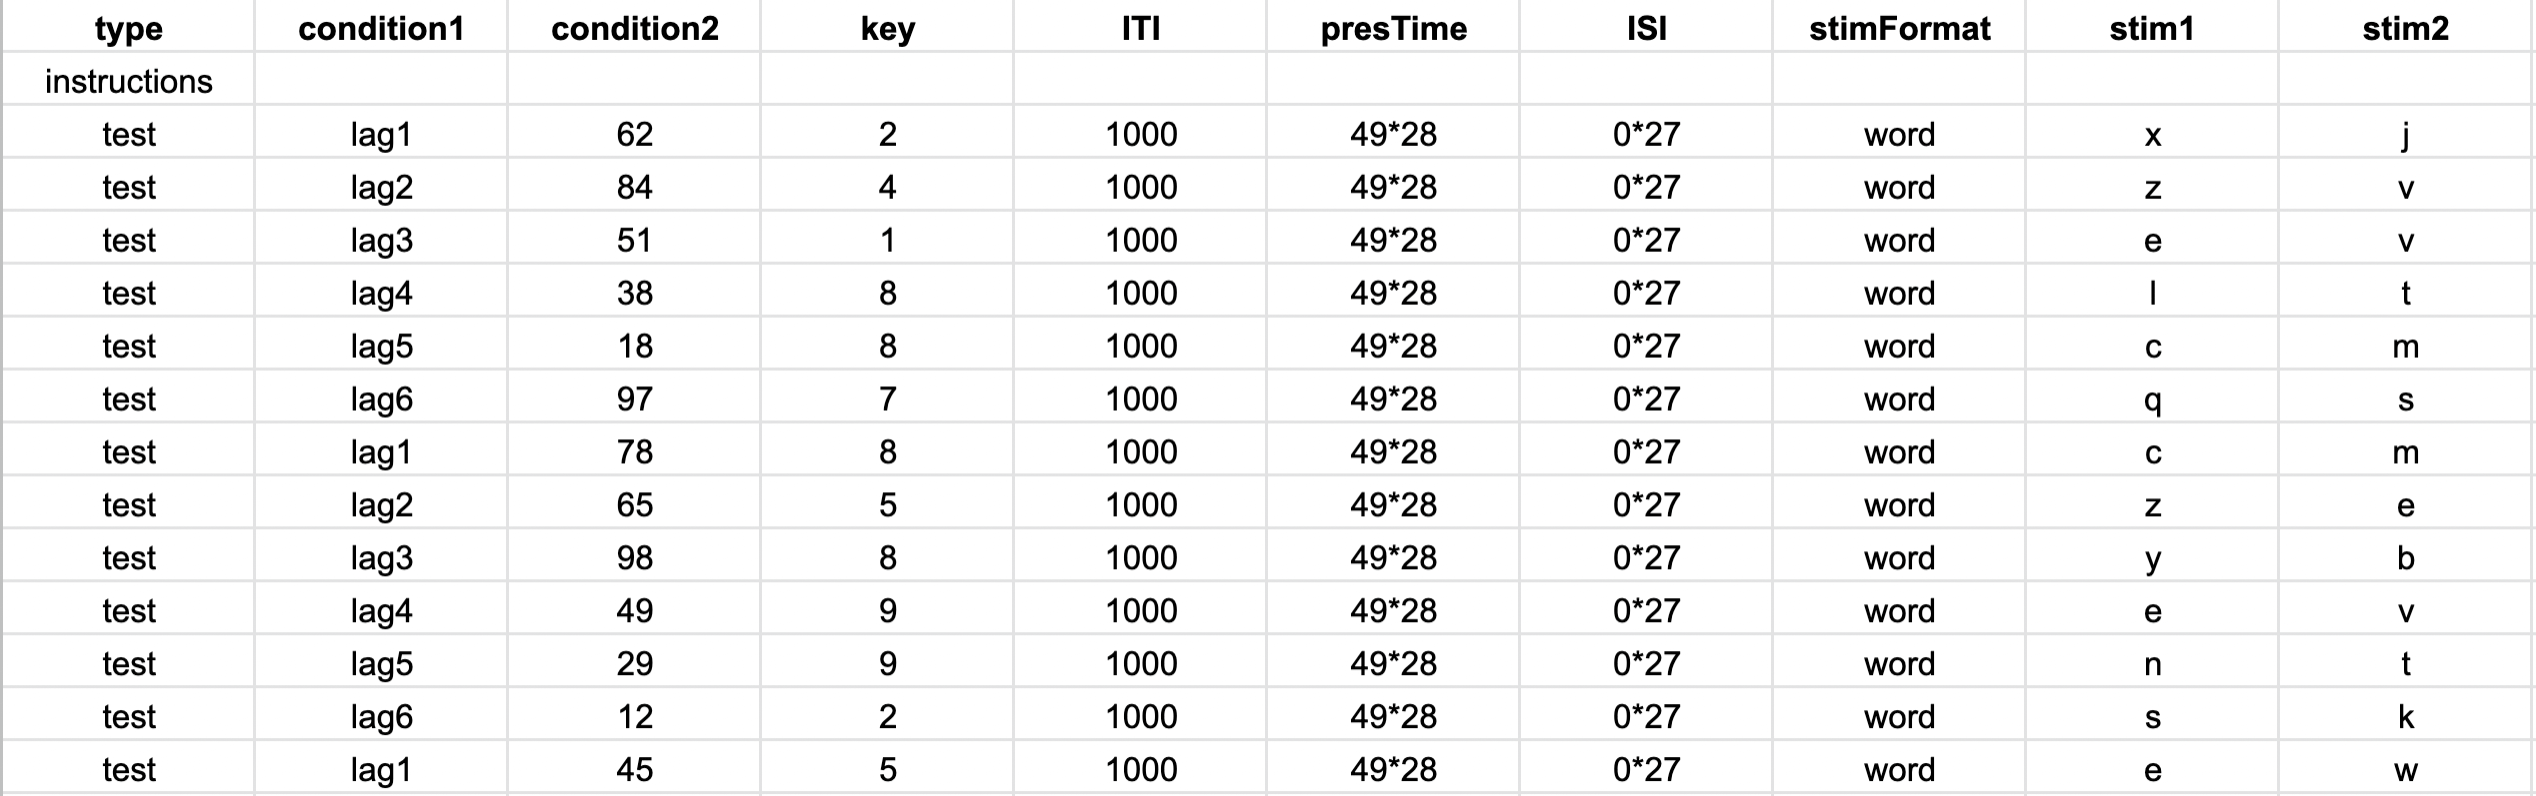
Experiments in Testable are fully customisable and you will not need to write a single line of code to edit them. The heart of each experiment is what we call the trial file. The trial file contains all information that Testable needs to run the experiment in a simple spreadsheet, that you can edit with any spreadsheet editor you like, such as Google Sheets , Excel, or Testable’s in-built preview editor.
To change any part of your experiment, you only need to change the values in the trial file.
Here are a few examples of changes you might want to make to the AB-Task:
Presentation time
You can vary the duration that each stimulus is presented for by changing the values in the presTime column. In the AB-task normally every stimulus is presented for the same duration, so we are using the shorthand 49*28, which means that each of 28 stimuli are presented for 49 milliseconds. 20*28 would change the duration of all stimuli within that trial to 20 milliseconds.
Note: Bear in mind that most monitors have a refresh rate of 60Hz. This means that the shortest presentation time that can be reliably achieved is 17ms.
SOA (Stimulus Onset Asynchrony)
Another metric that researchers commonly manipulate is the SOA (Stimulus Onset Asynchrony). It describes the time between the onset of one stimulus to the onset of the next. The SOA is composed of the presentation time and the inter-Stimulus Interval (ISI). When the ISI is 0, the SOA is equal to the presentation time. You can change the ISI in the ISI column, using the same shortcut as for the presentation time. 0*27 means that the time between the 28 stimuli is 0ms.
Lag position and stimulus identity
Both lag position and stimulus identity are varied and randomly presented in the template setup. By modifying the stimulus columns, you have control about what to present at each of the lag positions in the visual presentation stream.
Once you have made your changes, you can save and upload the modified trial file to your experiment’s trial file section.
After importing this template to your library, you can collect data for your experiment by sharing the unique experiment link (i.e. tstbl.co/xxx-xxx) with your participants. Once participants complete the experiment, their results will appear in the ‘Results’ section of your experiment.
The main dependent variable that you will use in your analysis is the participants’ accuracy. Did their keyboard response match the identity of the second stimulus?
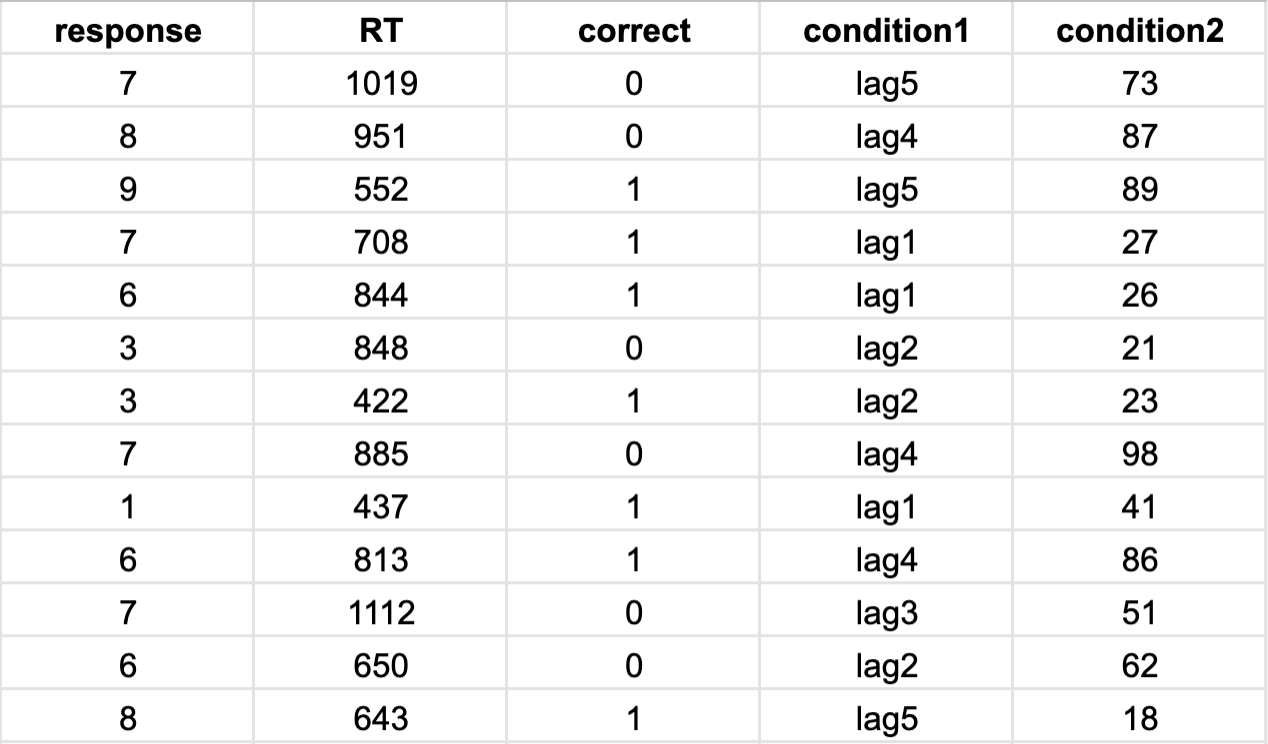
You will want to look at the accuracy separately for each different lag position of the second stimulus. To accomplish this, it can be useful to create a helper-column that assigns each trial to a condition, depending on the position of the second stimulus. This means you can group the accuracy score by condition and compute the condition averages.
Finally, you can create a plot that shows the lag position on the X-axis and the average accuracy for trials with that lag on the Y-axis to visualise the attentional blink.
Reference list:
Raymond, J. E., Shapiro, K. L., & Arnell, K. M. (1992). Temporary suppression of visual processing in an RSVP task: An attentional blink?. Journal of experimental psychology: Human perception and performance, 18(3), 849.
Dux, P. E., & Marois, R. (2009). The attentional blink: A review of data and theory. Attention, Perception, & Psychophysics, 71(8), 1683-1700.